
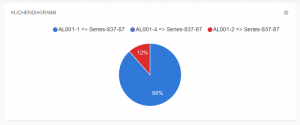
The “Pie chart” widget displays data points (measured values) with current values in a pie chart.
Application example: You monitor several tanks and want to quickly and easily detect which tank is currently the fullest.

Configurable parameters:
- Title: Widget title. By default, the widget type is used as the title
- Pie chart options: Selection options for the display of tooltips, percentages and legends in the pie chart
- Data points: Displays a list of data points available. You have to activate one data point at least. Click Add data point to add a data point to the list. You will find additional information in “Adding data points”.