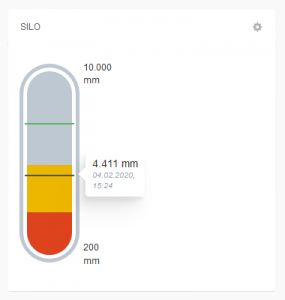
The “Silo” widget displays data points (measured values) with current values in a silo view.
In the configuration you can also specify a “yellow” and “red” value range and a “green” target value in the configuration for better visualisation. That way fast identification whether the measured value is inside the normal range is possible.
Application example: You want to monitor the temperature and humidity of a drying room and set up 2 silo widgets with yellow and red value ranges and target values. Thus you can see at first glance whether the values are within the accepted range and can quickly readjust if necessary.


Configurable parameters:
- Title: Widget title. By default, the widget type is used as the title
- Data points: Displays a list of data points available. You have to activate one data point at least. Click Add data point to add a data point to the list. You will find additional information in “Adding data points”.
