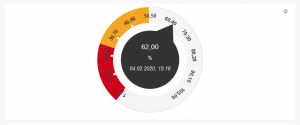
The “Tachometer” widget visualises data points as a tachometer. Minimum and maximum target values and the currently present measured value are also displayed.
In the configuration you can also specify a “yellow” and “red” value range and a “green” target value in the configuration for better visualisation. That way fast identification whether the measured value is inside the normal range is possible.
You have to activate at least one data point to be able to create the “Linear pointer” widget.
Application example: You are looking at the volume flow of a medium in a pipeline. With the speedometer widget, you can monitor it easily and quickly at any time and, if it drops into the red value range, increase the pressure in the pipe.