
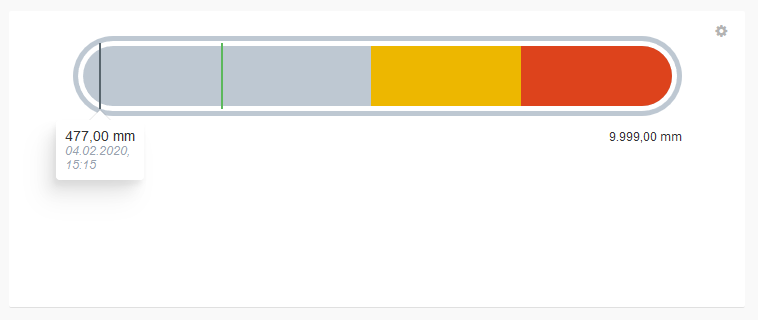
The “Linear pointer” widget visualises data points as a linear measuring device. Minimum and maximum target values and the currently present measured value are also displayed. You have to activate at least one data point to be able to create the “Linear pointer” widget.
In the configuration you can also specify a “yellow” and “red” value range and a “green” target value in the configuration for better visualisation. That way fast identification whether the measured value is inside the normal range is possible.
Application example: You can see at first glance whether the distance measured by the laser distance sensor is within the target range.

Info: If a lettering cannot be displayed completely, you can make do by increasing the minimum and maximum values and thus move the lettering in the viewable range.