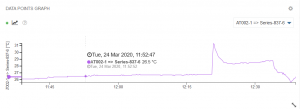
The “Data point graph” widget displays a data point (measured value) in a graph. The visualisation is identical to the one in the Default dashboard of the sensor. The easiest way to create a “Data point graph” widget is to select it from the dropdown menu, add one or several data points of your sensor and activate it.
Application example: You monitor the temperature of a storage room and want to know how it has behaved over the past day (or any other period).